

In the two defect models examined by a 2022 Energies study, SF₆ had the highest partial-discharge inception voltage (PDIV), fluoronitrile-based g³ was intermediate, and dry air was lowest at the same pressure. The difference was largest for a sharp protrusion on the conductor and smaller for a free-moving metallic particle. Once discharge began, however, the shape and frequency spectrum of one pulse did not reliably identify the gas.
That result is useful for gas-insulated switchgear design, but it is not a ranking of finished GIS products. The experiment used defined electrodes, pressures from 0.1 to 0.5 MPa, and a specific 5% fluoronitrile/CO₂/O₂ mixture. Enclosure geometry, field grading, materials, gas quality, pressure, manufacturing cleanliness, monitoring bandwidth, and test procedure all affect the behavior of real equipment.
Why partial discharge is a different question from breakdown voltage
Breakdown voltage describes the point at which an insulation path can no longer withstand the applied electrical stress. Partial discharge (PD) begins earlier: a localized region discharges while the insulation between the main conductors has not completely bridged.
In GIS, local electric stress may be intensified by a conductor burr, sharp edge, metallic particle, floating component, void, contaminated surface, or assembly defect. Repeated PD can degrade nearby insulation and can be evidence of an incipient defect. This is why a gas comparison based only on bulk dielectric strength or final breakdown voltage is incomplete.
The practical questions are more specific:
- At what applied voltage does measurable PD begin under a defined defect and pressure?
- Does the defect produce a repeatable phase-resolved pattern?
- Can the installed measurement system detect the discharge with enough sensitivity?
- Does a change of gas require changes to field grading, pressure, geometry, cleanliness, or acceptance criteria?
The current IEC 60270:2025 covers charge-based PD measurement, including quantities, measuring circuits, calibration, test procedures, and discrimination from external interference. UHF detection can complement charge-based measurement in GIS, but a UHF voltage in millivolts is not automatically an apparent charge in picocoulombs; the propagation path and sensor installation matter.
What the study compared
The source paper is “Comparison between the PD Characteristics of g³ and Dry Air for Gas-Insulated Switchgears”, published by Goang-Chul Shin, Sung-Wook Kim, and Gyung-Suk Kil in Energies in 2022.
It compared three insulating media:
| Medium | Study description | Important boundary |
|---|---|---|
| SF₆ | Conventional sulfur hexafluoride reference gas | Strong electron attachment and established GIS use do not remove the need for defect control or gas management. |
| g³ | In this experiment, 5% Novec 4710 fluoronitrile with CO₂ and O₂ | g³ is a GE Vernova technology name. The tested mixture and pressure must not be generalized to every fluoronitrile product. |
| Dry air | A nitrogen/oxygen medium without fluorinated greenhouse gas | “Dry air” is not one universal equipment design; moisture, pressure, geometry, interruption technology, and OEM implementation still matter. |
GE Vernova currently describes g³ for metal-enclosed switchgear as a CO₂-O₂ mixture with a small amount of C₄F₇N fluoronitrile. Siemens Energy describes its Clean Air technology as approximately 80% nitrogen and 20% oxygen, used with vacuum interruption. These are manufacturer technology descriptions, not proof that any unrelated GIS or RMU uses the same formulation.
Two defects produced two different comparisons
The experiment used two artificial defect systems. They should be read as controlled models of defect physics, not full reproductions of an operating GIS bay.
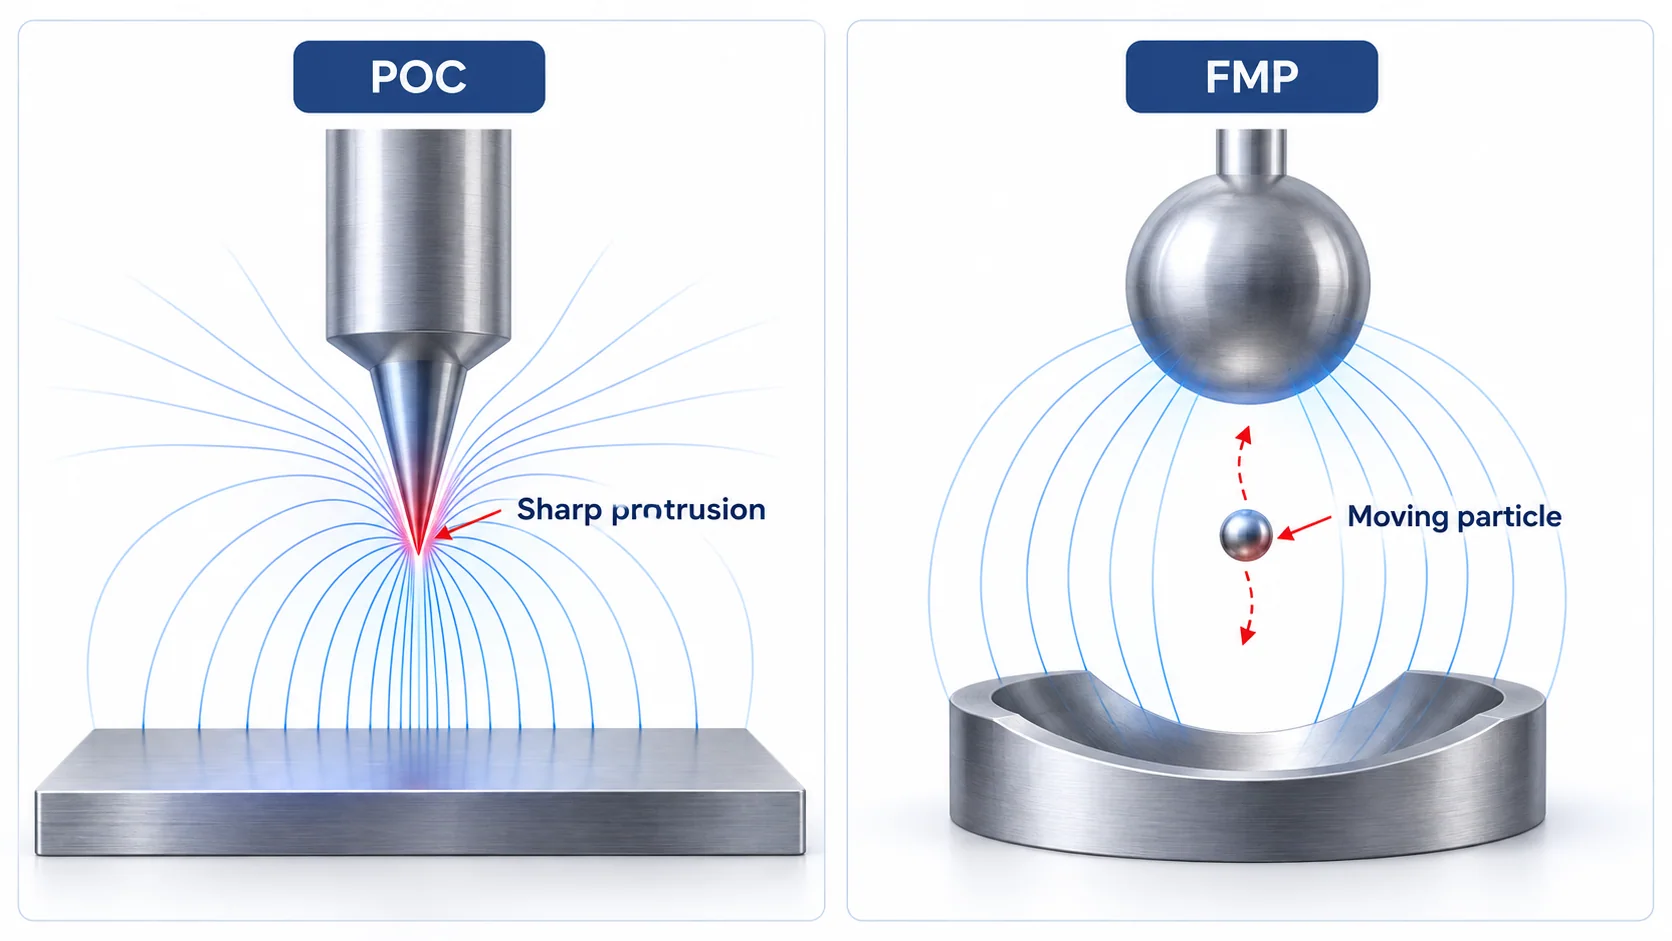
Protrusion on conductor: POC
The POC model used a needle electrode with a 10 μm tip radius facing a plane electrode. It represents a fixed sharp point such as a burr, machining imperfection, weld feature, or assembly damage on an energized conductor.
Because the field concentrates strongly at the tip, POC is especially useful for examining how the gas responds in a highly non-uniform electric field. It also makes surface finish, edge radius, shielding, and field control central design variables.
Free-moving particle: FMP
The FMP model placed a 2 mm metallic sphere between a spherical high-voltage electrode and a concave grounded electrode. It represents a conductive particle that can move or bounce under the alternating electric field.
This defect shifts attention from a fixed field-enhancement point to contamination control, assembly cleanliness, particle trapping, enclosure geometry, and the dynamics of a mobile object.
PDIV increased with pressure, but the gap depended on the defect
The researchers filled each electrode system with each gas from 0.1 to 0.5 MPa. Voltage was raised until PD above 10 pC first appeared; that voltage was defined as PDIV. Each condition was measured five times and averaged.
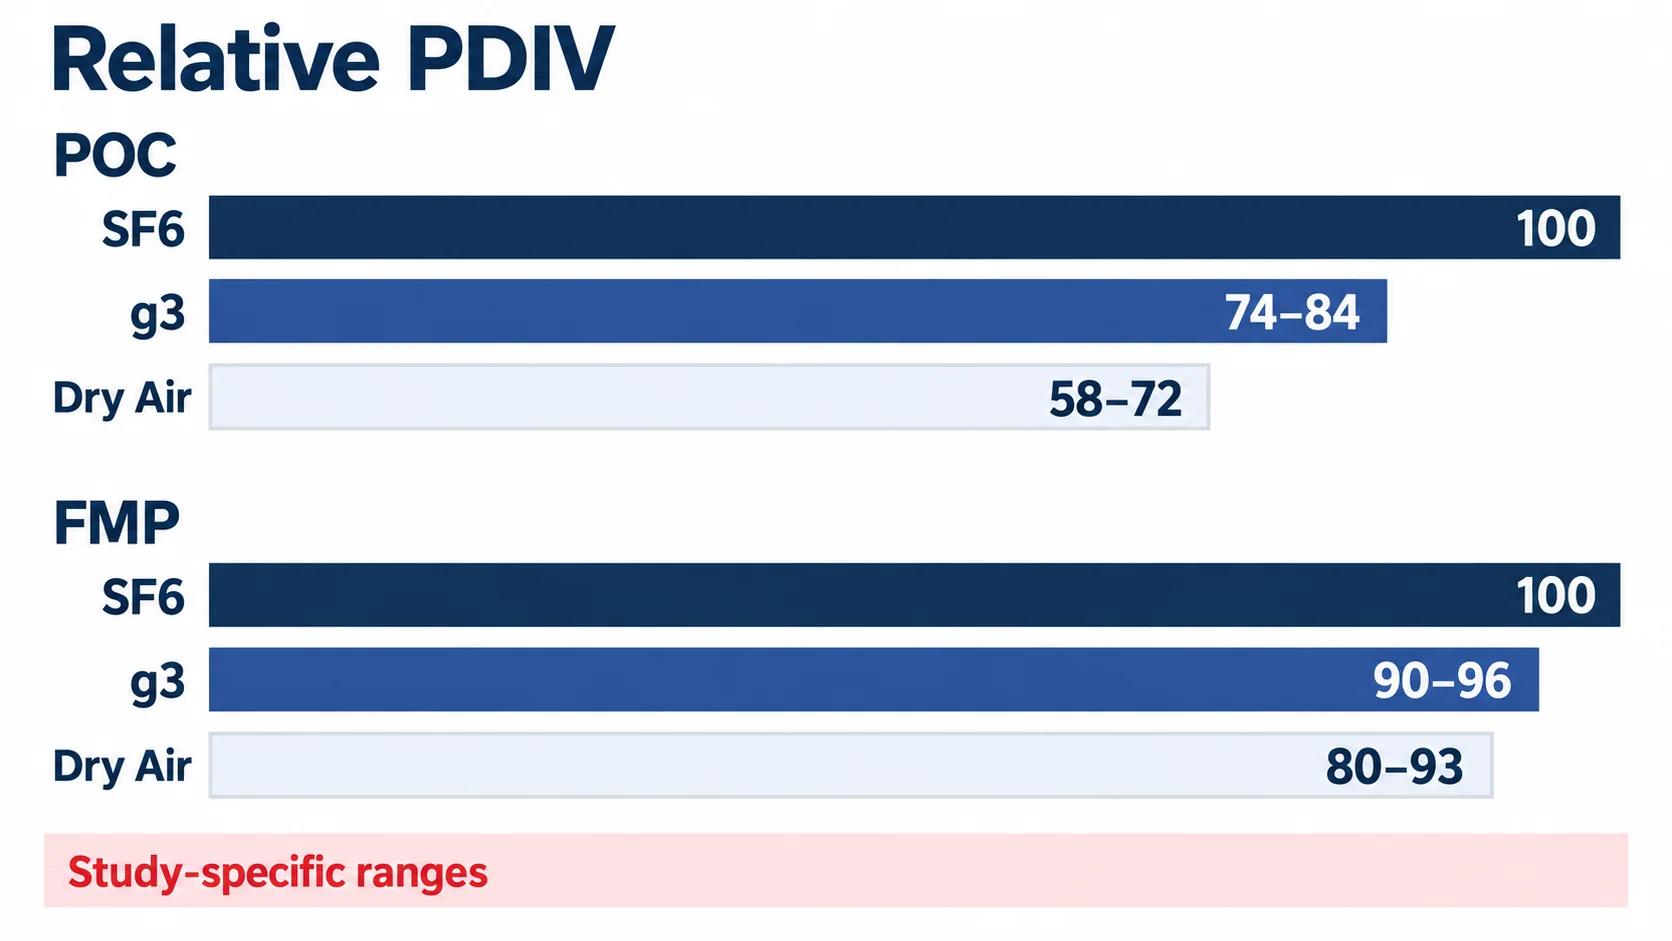
Across both defect systems, PDIV increased approximately linearly with gas pressure. At equal pressure, the ordering was consistently SF₆, then g³, then dry air. The relative ranges reveal the more important result: gas choice mattered much more for the sharp conductor protrusion than for the moving particle.
| Defect model | g³ PDIV relative to SF₆ | Dry-air PDIV relative to SF₆ | Interpretation |
|---|---|---|---|
| POC | 74%–84% | 58%–72% | Strong separation under a highly non-uniform field; dry air was particularly sensitive to the sharp tip in this setup. |
| FMP | 90%–96% | 80%–93% | The relative gap narrowed; particle motion and geometry contributed strongly to discharge behavior. |
The paper also reported approximate pressure equivalences within its test geometry. For POC, g³ at 0.4 MPa and dry air at 0.5 MPa produced PDIV values near SF₆ at 0.2 MPa. For FMP, those alternatives at the same respective pressures were near SF₆ at 0.3 MPa.
Those relationships are not conversion factors for equipment specifications. Raising pressure can increase PDIV, but it also affects enclosure stress, sealing, gas density monitoring, filling procedures, temperature margin, pressure relief, and the complete insulation design. An OEM must validate the finished equipment, not simply substitute a pressure ratio from an electrode experiment.
A single pulse did not reliably identify the gas
The study measured PD with a conventional charge-based arrangement and with a UHF sensor. The researchers compared individual pulses in the time domain and by fast Fourier transform.
Pulses in g³ and dry air generally showed slightly longer rise time, fall time, and width than those in SF₆, while dry air tended to have the largest relative FFT magnitude. The physical explanation is plausible: SF₆ is strongly electronegative and captures free electrons, suppressing avalanche development more effectively than the alternatives under the test conditions.
Yet the distributions overlapped enough that the authors did not find a clear, stable gas identifier in one pulse shape or frequency spectrum. This has a direct monitoring implication: changing the gas does not justify diagnosing a defect from one waveform feature alone. Sensor transfer characteristics, noise, propagation path, phase pattern, repetition rate, apparent charge, operating voltage, and baseline data should be considered together.
PRPD exposed the strongest difference for a sharp protrusion
A phase-resolved partial-discharge (PRPD) plot maps discharge events against the phase of the AC voltage. It preserves information that a single isolated pulse discards: where in the cycle discharge occurs, how widely it spreads, how often it repeats, and how positive and negative half-cycles compare.
For the POC model, the reported phase windows widened from SF₆ to g³ to dry air:
| Gas | Positive half-cycle | Negative half-cycle |
|---|---|---|
| SF₆ | 70°–88° | 258°–276° |
| g³ | 61°–107° | 247°–285° |
| Dry air | 49°–153° | 234°–332° |
Under the paper’s stated POC measurement condition, pulse counts were 24 events/s for SF₆, 42 events/s for g³, and 1,716 events/s for dry air. The dry-air count was therefore 71.5 times the SF₆ count in that one model and condition.
That striking number must not be presented as “dry-air GIS has 71.5 times more PD.” It is not a fleet statistic, reliability ratio, or product qualification result. It shows that this sharp-tip model produced a much broader and more repetitive discharge pattern in dry air under the selected voltage, pressure, electrode geometry, and detection setup.
For FMP, discharges appeared through 0°–360° for all three gases. The pulse counts—90 events/s for SF₆, 123 for g³, and 135 for dry air—were much closer. Defect type and field distribution therefore changed the comparison more than a simple gas ranking suggests.
What the findings change in GIS design and manufacturing
The paper supports five practical conclusions for an SF₆-free design review.
1. Field optimization becomes part of the gas decision
If an alternative medium has lower PDIV at the same pressure under a non-uniform field, the engineering response may combine larger clearances, smoother conductor profiles, greater edge radii, shields, optimized spacer interfaces, higher pressure, or a different enclosure arrangement. The correct combination is product-specific.
2. Surface finish and burr control are functional insulation controls
The POC result makes machining, deburring, weld finishing, coating integrity, cleaning, inspection, and assembly protection more than cosmetic production steps. A sharp defect can dominate local stress even when the nominal gas and pressure are correct.
3. Particle control still matters in every gas
The smaller gas-to-gas spread in the FMP model does not make particles acceptable. It shows that particle geometry and motion strongly influence the discharge. Clean manufacturing areas, tool control, component washing, enclosure inspection, particle traps where applicable, and controlled assembly remain important.
4. Monitoring needs technology-specific baselines
UHF sensors may remain useful, but alarm logic and pattern interpretation should be validated for the equipment, gas, sensor, and defect database. A threshold or pattern learned from SF₆ equipment should not be transferred to another medium without evidence.
5. Higher pressure cannot replace design verification
Pressure improved PDIV in the experiment, but a finished GIS must satisfy its complete dielectric, thermal, mechanical, switching, sealing, internal-arc, environmental, and service requirements. Pressure is one coupled design variable, not a stand-alone correction.
What project buyers should request
When comparing SF₆, fluoronitrile-mixture, dry-air, or solid-insulation options, ask bidders to declare the technology and evidence instead of accepting a generic “eco-friendly GIS” label.
- exact insulating and interrupting media, including whether vacuum interrupters are used;
- rated filling pressure, minimum functional pressure, density/pressure monitoring, leakage assumptions, and temperature range;
- dielectric qualification and applicable equipment-standard test evidence for the offered design;
- PD measurement method, calibration basis, acceptance criterion, test voltage, noise limit, and whether UHF monitoring is included;
- conductor, spacer, shield, cable-interface, and field-grading design boundaries;
- manufacturing controls for burrs, particles, cleaning, moisture, gas purity, filling, and sealed-compartment assembly;
- type-test and routine-test scope, with clear linkage between the evidence and the offered configuration;
- gas handling, recovery, training, maintenance, end-of-life, and regulatory responsibilities;
- deviations from the utility specification and any limits on extension, repair, or gas replenishment.
These inputs belong beside the SLD, ratings and module schedule described in the MV switchgear quotation checklist and the utility distribution switchgear guide.
CANGO product boundary
CANGO’s medium-voltage switchgear category includes the SRM-12 gas-insulated ring main unit and the GTXGN-12 solid-insulated ring main unit, alongside air-insulated switchgear families. The available CANGO catalog identifies the insulation class of these families but does not establish that SRM-12 uses g³ or Siemens Clean Air, nor does it establish the PDIV or PRPD results discussed in this research paper.
Use the medium-voltage switchgear selection guide to place insulation technology within the wider project decision. For a configuration review, provide the SLD, voltage and current ratings, fault duty, insulation-medium requirement, environmental conditions, cable interfaces, monitoring specification, utility standard, test-document requirements, quantity, and destination.
REQUEST A SWITCHGEAR CONFIGURATION REVIEW ↗
Reference
Shin, G.-C.; Kim, S.-W.; Kil, G.-S. “Comparison between the PD Characteristics of g³ and Dry Air for Gas-Insulated Switchgears.” Energies 2022, 15(19), 7043. https://doi.org/10.3390/en15197043.